Malaysia Has 33,094 Unsold Homes — Should You Wait for Property Prices to Fall?
The real issue may not be a nationwide housing glut, but a national new-home absorption problem.
The number everyone is quoting
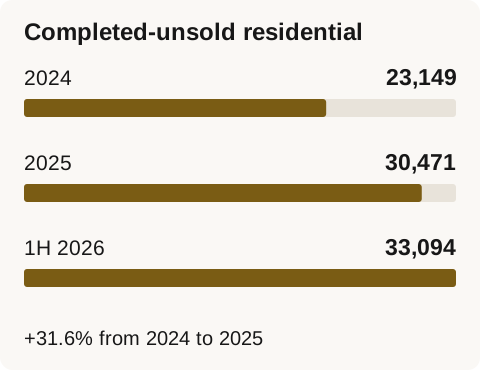
As at the first half of 2026, Malaysia had 33,094 completed residential units that remained unsold. The direction matters as much as the number itself: completed-unsold residential stock stood at 23,149 units at the end of 2024, increased to 30,471 in 2025, and rose again to 33,094 in the first half of 2026.
The jump from 2024 to 2025 alone was 31.6%.
That is a real deterioration. If your first reaction is to wait another year and see whether prices become more negotiable, that instinct is not irrational.
But there is a gap between the statistic and the decision.
The statistic is national. The decision is not.
Almost nobody buys “Malaysian property.” You buy one unit, in one project, in one neighbourhood, competing against a specific set of alternatives for a specific pool of buyers or tenants.
So the useful question is not simply whether 33,094 is a big number.
It is what the number measures, how supply pressure actually reaches property prices, and whether the specific property you are considering is exposed to that pressure.
What “unsold” actually counts
NAPIC has a specific definition of property overhang. It covers completed units that have obtained the relevant completion certification but remain unsold for more than nine months after being launched for sale.
That makes completed-unsold stock fundamentally a developer inventory measure.
It is not the same thing as vacant homes.
It is not the subsale market, where an existing owner sells to another buyer.
It is not mortgage distress.
It is not stock that is still being constructed.
And it is not a measure of whether Malaysia has more total housing than its households need.
Narrow does not mean unimportant.
A rising stock of finished homes that developers have not yet sold is a direct signal that part of the primary market is not clearing. It simply answers a narrower question than the phrase “Malaysia has too many houses” suggests.
The stock that still has to find buyers
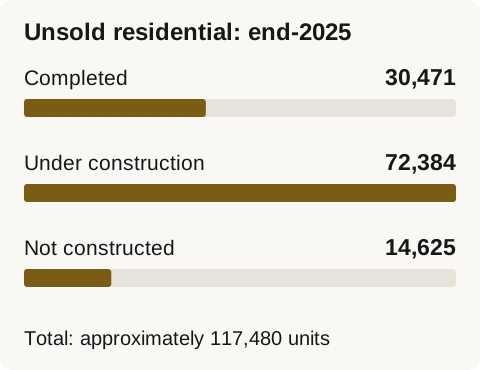
The completed-unsold figure is only one part of the supply picture.
At the end of 2025, Malaysia had approximately:
| Stage | Unsold residential units |
|---|---|
| Completed | 30,471 |
| Under construction | 72,384 |
| Not yet constructed | 14,625 |
| Total | 117,480 |
The completed figure was roughly a quarter of that total. Unsold units already under construction were more than double the completed-unsold stock.
But these categories answer different questions.
The completed-unsold figure shows what has already failed to clear. The wider pipeline shows how much additional stock still needs to find buyers before completion.
The absorption test is not over yet.
Some of those 72,384 units will sell before completion. Projects that have not yet started can be delayed, redesigned, repriced or never built.
So 117,480 should not be described as future overhang.
It is better understood as a measure of how much selling still needs to happen while new supply continues moving through the pipeline.
That only becomes dangerous if buyers are not keeping pace.
So are they?
Malaysia does have a new-home absorption problem
Several indicators point in the same direction.
Malaysia completed 99,877 residential units in 2025, the highest annual total in five years.
In the first half of 2026, 27,832 new residential units were launched, with NAPIC reporting sales performance of just 16.6%.
At the same time, completed-unsold residential inventory continued rising rather than stabilising.
Serviced apartments add another layer of risk. They are reported separately from residential overhang, and by the first half of 2026 there were 23,375 completed-unsold serviced-apartment units, worth RM19.33 billion.
Taken together, these indicators are difficult to dismiss as a single-quarter fluctuation.
The defensible conclusion is:
Malaysia is currently delivering and launching new housing faster than the primary market is absorbing it at prevailing prices, product mix and financing terms.
Every part of that sentence matters.
Currently means this is a reading of present conditions, not a permanent law.
At prevailing prices, product mix and financing terms matters because absorption can change. Units that do not sell today may sell at a lower effective price, under a different package, or when financing and buyer confidence improve.
Weak absorption therefore does not mean Malaysians no longer want housing.
And it still does not prove that Malaysia has more total homes than households need.
Why “Malaysia has too many homes” is still the wrong conclusion
Compare these two statements:
Malaysia has too many homes.
and:
Malaysia is currently delivering and launching new homes faster than the primary market is absorbing them.
Only the second is established by the evidence above.
The first requires a different analysis entirely.
To establish structural national housing oversupply, we would need to compare total housing-stock growth against household formation, actual occupancy, unoccupied dwellings, obsolete stock being removed, second homes, migration and other sources of housing demand.
Developer inventory cannot answer that by itself.
Not proven is not the same as disproven.
This is not an argument that Malaysia definitely does not have a structural national housing surplus.
It is an argument that the evidence currently available establishes something narrower: a national new-housing absorption problem.
That is already serious enough. It does not need to be inflated into a conclusion the data cannot yet support.
Why foreign unsold-home numbers do not settle this
It is tempting to say Hong Kong, Singapore or Taiwan also have unsold homes and therefore Malaysia is fine.
That comparison does not work.
Completed-unsold developer stock is not the same as vacancy. Vacancy is not the same as developer inventory. Pipeline supply is not completed supply. Taiwan-style low-use housing measures are not equivalent to NAPIC overhang.
Raw unit counts across countries with different definitions and different housing-market structures tell us very little without matching denominators.
International evidence is useful mainly because it teaches us to ask better questions about measurement — not because it excuses Malaysia's inventory problem.
How supply pressure actually reaches prices
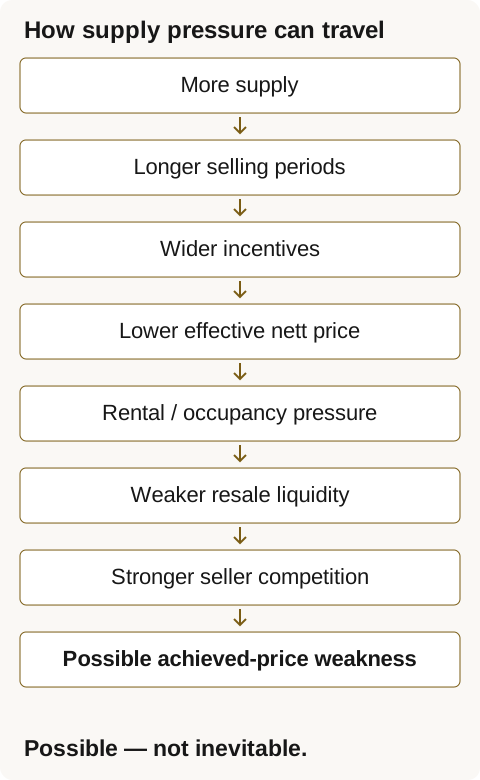
Weak absorption does not require an immediate property-price crash to matter.
The adjustment can happen gradually:
More supply → longer selling periods → wider incentives → lower effective nett prices → weaker rental power → thinner resale liquidity → stronger seller competition → possible pressure on achieved prices.
The word possible matters.
Not every market completes every step. Some recover before significant price declines occur.
But the early part of the sequence is especially important for buyers.
A developer facing slower sales may prefer to preserve the headline SPA price while adjusting the economics around it.
That can appear through rebates, fee absorption, furnishing packages, cashback, maintenance incentives or better unit selection.
So “the price hasn't dropped” can be misleading.
There are at least five different prices worth separating:
Asking price — what is advertised.
SPA price — what appears in the Sale and Purchase Agreement.
Effective nett price — what the buyer economically pays after rebates and incentives.
Current achieved market price — what comparable properties are actually transacting at.
Future resale achieved price — what the owner can eventually sell for.
Think of them as:
Advertised → Contract → Economic → Market → Exit
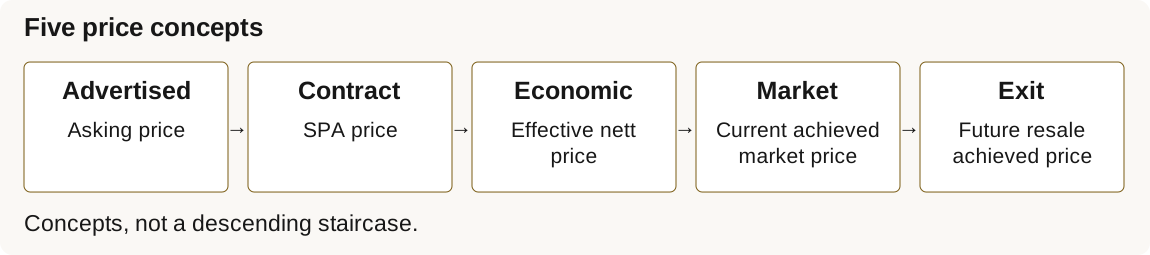
They are concepts, not a descending staircase.
The gap between SPA price and effective nett price is often where discounting becomes visible first.
For an investment buyer, eventual resale value is then one important test of whether the original entry price made sense.
What happened the last time overhang was this high
| Period | Completed-unsold residential units |
|---|---|
| 2018 | 32,313 |
| 2019 | 30,664 |
| 2024 | 23,149 |
| 2025 | 30,471 |
| 1H 2026 | 33,094 |
Malaysia's own history is more useful here than foreign comparisons.
In 2018, residential overhang reached 32,313 units.
In 2018, the overall Malaysian House Price Index still rose 3.3% for the year. Yet high-rise prices fell 0.9%, while detached-house prices fell 1.4%. A national index could therefore remain positive while particular property types weakened.
That distinction matters.
Someone watching only the national index could have concluded that Malaysian house prices were still rising while exposed segments were already weakening.
The index is not your property.
In 2019, national house-price growth slowed to 2.2%, while residential overhang remained elevated.
By H1 2020, overall property transaction volume was down 27.9% year on year. Yet the national All House index was still 1.4% higher year on year in Q2 2020, while the High-rise index was 0.5% lower. Covid-19 was a major contributor to the transaction shock, so the volume decline cannot be attributed to overhang alone. The useful lesson is narrower: transaction activity and exposed property types can weaken even while the aggregate national house-price index remains positive.
But the earlier pattern still gives us an important lesson:
Transaction activity and particular property segments can weaken without a dramatic fall in the national house-price index.
High overhang does not have to create a nationwide crash.
It can produce something quieter: slower liquidity, stronger incentives, localised price weakness and greater bargaining power for buyers.
This is the type of market in which patience can create bargaining power even without a national crash.
It is not a promise that every buyer who waits will benefit.
Why healthy mortgages do not close the argument
Malaysia's household credit position is currently much healthier than a classic property-crash narrative would imply.
At the end of 2025, Bank Negara Malaysia reported a 1.1% housing-loan impairment ratio. For individual property investors, the impairment ratio was even lower at 0.8%.
That matters.
Widespread forced selling is one mechanism that can turn a soft housing market into a severe price collapse. Current data do not show that dynamic operating at national scale.
But loan impairment answers a different question.
It tells us whether existing borrowers can continue servicing existing debt.
It does not tell us whether new projects are selling quickly, whether effective developer prices are softening, whether rents are weakening or whether resale liquidity is deteriorating.
Healthy mortgage books make a foreclosure-driven crash less likely.
They do not make softer prices, rents or liquidity impossible.
The risk is property-specific, not national
This brings the question back to where it belongs.
Don't ask whether Malaysia is oversupplied. Ask whether your property is replaceable.
Replaceability is not simply about how many units exist.
It is about how many close substitutes are competing for the same buyer or tenant at the same time.
A useful shorthand is:
Oversupply exposure = close substitutes relative to effective demand.
Both sides of that matter.
A thousand units can be absorbed where demand is deep and the products serve different buyer groups.
Two hundred near-identical units can be problematic where the tenant and buyer pool is narrow.
And when many owners are selling similar units at the same time, the most motivated sellers can reset the comparables against which everybody else's unit is judged.
Exposure tends to rise where you have large nearby supply, a heavy future completion pipeline, many identical layouts, weak rental power, slow resale liquidity, widening developer incentives, investor-heavy ownership and little meaningful differentiation.
National new-home overhang may tell you much less about a scarce mature landed property, a strongly owner-occupied product, an unusual layout or an established neighbourhood with limited substitute supply.
That does not make those properties “safe.”
It simply means this particular risk — excess competing supply — is weaker.
So should you wait?
There is no single answer because different buyers are exposed to different parts of the problem.
Among the buyer types discussed here, new-launch investors have the clearest evidence-based reason to consider waiting or negotiating more aggressively.
Weak launch absorption and a substantial amount of unsold stock still under construction can create bargaining leverage, particularly through incentives and nett pricing.
That does not guarantee a better deal later.
For a high-density high-rise or serviced-apartment buyer, the case is less “wait automatically” and more “investigate before committing.” Check what else will complete nearby, what rent is actually being achieved, how broad the tenant pool is and how many near-identical alternatives will compete for the same renter or future buyer.
For a subsale investor, waiting may make sense when new developer stock is about to complete nearby. A private seller can find themselves competing against developers offering rebates, furnishings and absorbed transaction costs that an individual owner cannot easily replicate.
For a long-term owner-occupier, the national data should carry less weight. If a home genuinely suits the household, is scarce for its type and is fairly priced against real transactions, the national overhang figure alone is weak evidence for delaying the purchase.
The same applies even more strongly to a scarce mature landed or differentiated owner-occupier property.
There may be excellent reasons to wait — price, financing, condition, personal timing or transaction-specific issues.
But the national 33,094 figure, by itself, is weak evidence for doing so.
Waiting also has a cost. You may continue paying rent. Financing conditions or loan eligibility can change. A genuinely scarce unit can disappear.
Patience is a strategy, not a free option.
The Replaceability Test
Before deciding whether today's national inventory should worry you, check the actual property.
| Check | What to ask |
|---|---|
| Competing supply | How many close substitutes are available right now? |
| Future pipeline | What similar stock will complete nearby over the next few years? |
| Unit fungibility | How many units in the same project are almost interchangeable with mine? |
| Tenant-pool depth | Who actually rents here, and how broad is that demand? |
| Rental strength | What rents are actually achieved, rather than merely advertised? |
| Resale liquidity | How long do comparable units take to transact? |
| Developer incentives | What are nearby developers giving away, and are those packages widening? |
| Nett price vs completed alternatives | What am I really paying after incentives compared with an existing finished option? |
| Owner-occupier demand | Are people buying mainly to live here, or mainly to rent out? |
Do not turn these into a fake numerical score.
Read the pattern.
If the property is easily replaceable on several dimensions, its exposure to supply pressure is higher.
If the answers are mixed, identify exactly where the weakness sits and negotiate around it.
If close substitutes are genuinely scarce, national overhang is weaker evidence for delaying the purchase. Price, financing and suitability become more important.
If you only have one afternoon, start with competing supply, future pipeline and recent resale liquidity. Not because they have been statistically proven to predict prices best, but because they are relatively observable.
What would change this conclusion?
Malaysia's new-housing absorption problem is real.
It gives buyers a reason to ask harder questions, compare more aggressively and, in some segments, consider patience.
What it does not justify is a blanket forecast that Malaysian property prices must crash — or that every buyer should buy now because the banking system remains healthy.
National overhang tells you when to investigate. Local substitute supply tells you whether to worry.
This conclusion should also remain open to revision.
If future evidence shows total Malaysian housing-stock growth materially and persistently outrunning household formation and occupancy demand, then the diagnosis should move beyond a new-housing absorption problem toward something more serious: structural national oversupply.
Until then, the more useful exercise is smaller and more local.
Take the property you are actually considering. Examine how many credible substitutes are competing for the same buyer or tenant — and how deep that demand really is.
That will tell you more about your risk than the national headline ever could.
Sources
- NAPIC — Property Market Report 2024 / overhang definition - Official overhang definition; 2024 residential completed-unsold stock.
- NAPIC — Property Market Status Report 2025 - End-2025 completed, under-construction and not-constructed unsold residential stock.
- NAPIC — Property Stock Report 2025 - 2025 residential completions and housing stock.
- MOF / NAPIC — H1 2026 property-market release - H1 2026 completed-unsold residential stock, residential launches and launch sales performance.
- Bank Negara Malaysia — Financial Stability Review 2H 2025: Credit Risk - End-2025 housing-loan and individual property-investor impairment ratios.
- Bank Negara Malaysia — Financial Stability Review 2H 2025 - Parent report for the credit-risk chapter.
- NAPIC — Residential overhang exceeding five years - 2018 residential overhang: 32,313 units.
- NAPIC — Property Market 2023 Snapshot - 2019–2023 historical overhang trend; not a substitute for missing segment-price or H1 2020 tables.
- Ministry of Finance — H1 2026 Property Market Report launch speech - H1 2026 residential and separately reported serviced-apartment completed-unsold inventory; speech points 21–22.
- NAPIC — Property Market Report 2025: retrospective MHPI series - 2018 and 2019 annual house-price changes; PDF page 24, Chart 20.
- NAPIC — Property Market H1 2024 Snapshot - H1 2020 total property transactions declined 27.9% year on year; PDF page 1.
- NAPIC — Malaysian House Price Index Q1–Q2 2025P - Q2 2020 year-on-year changes: All House +1.4%, High-rise −0.5%; PDF pages 4 and 7, Charts 1 and 6.